
The U.S. immigration court system is facing unprecedented strain. Data from the Docketwise 2025 State of the Immigration report shows that by the end of 2024, over 3.7 million cases were pending in immigration courts across the country—a record-setting backlog that highlights the scale and urgency of the issue. This staggering number, which nearly doubled in just two years, underscores a system at its breaking point.
For immigration attorneys, understanding these court statistics isn't just about tracking trends—it's about proactively responding to systemic shifts that directly impact clients. Whether advising on asylum strategy, estimating immigration court backlog wait times, or managing firm resources, the ability to interpret and act on court data is becoming a core competency.
In this article, we’ll review some of the most telling insights from the 2025 State of Immigration Report, zooming in on immigration court case outcomes, backlog trends, and what it means for your law firm.
How Many Cases are in Immigration Court?
The volume of immigration court case completions has surged over the past five years, reflecting a court system under mounting pressure:
2020: 231,699 cases completed
2021: 272,749 cases completed
2022: 435,063 cases completed
2023: 674,848 cases completed
2024: 914,812 cases completed
This five-year trend reflects a system still rebounding from the effects of the pandemic, with courts working through significant backlogs and new case inflows. The sharpest year-over-year increases occurred from 2022 onward, highlighting both a growing effort to address the court’s immense workload and the scale of the challenge still ahead.
While these numbers suggest improved court throughput, they also show the continued strain imposed by new case filings and limited judicial capacity—reinforcing the growing urgency for systemic reforms and greater court resources.
Court Case Outcomes by Year
Reviewing the past three years reveals consistent outcome patterns, with removal orders and terminations each accounting for around one-third of resolved cases:
Outcome Type | 2022 | 2023 | 2024 |
Removal Orders | 162,980 (37%) | 251,589 (37%) | 315,864 (35%) |
Terminations | 133,648 (31%) | 239,080 (35%) | 323,489 (35%) |
Relief Granted | 29,984 (7%) | 43,501 (6%) | 48,952 (5%) |
Voluntary Departures | 9,740 (2%) | 10,770 (2%) | 8,936 (1%) |
Other Outcomes | 58,711 (13%) | 130,045 (19%) | 217,571 (24%) |
Total Completions | 435,063 | 674,848 | 914,812 |
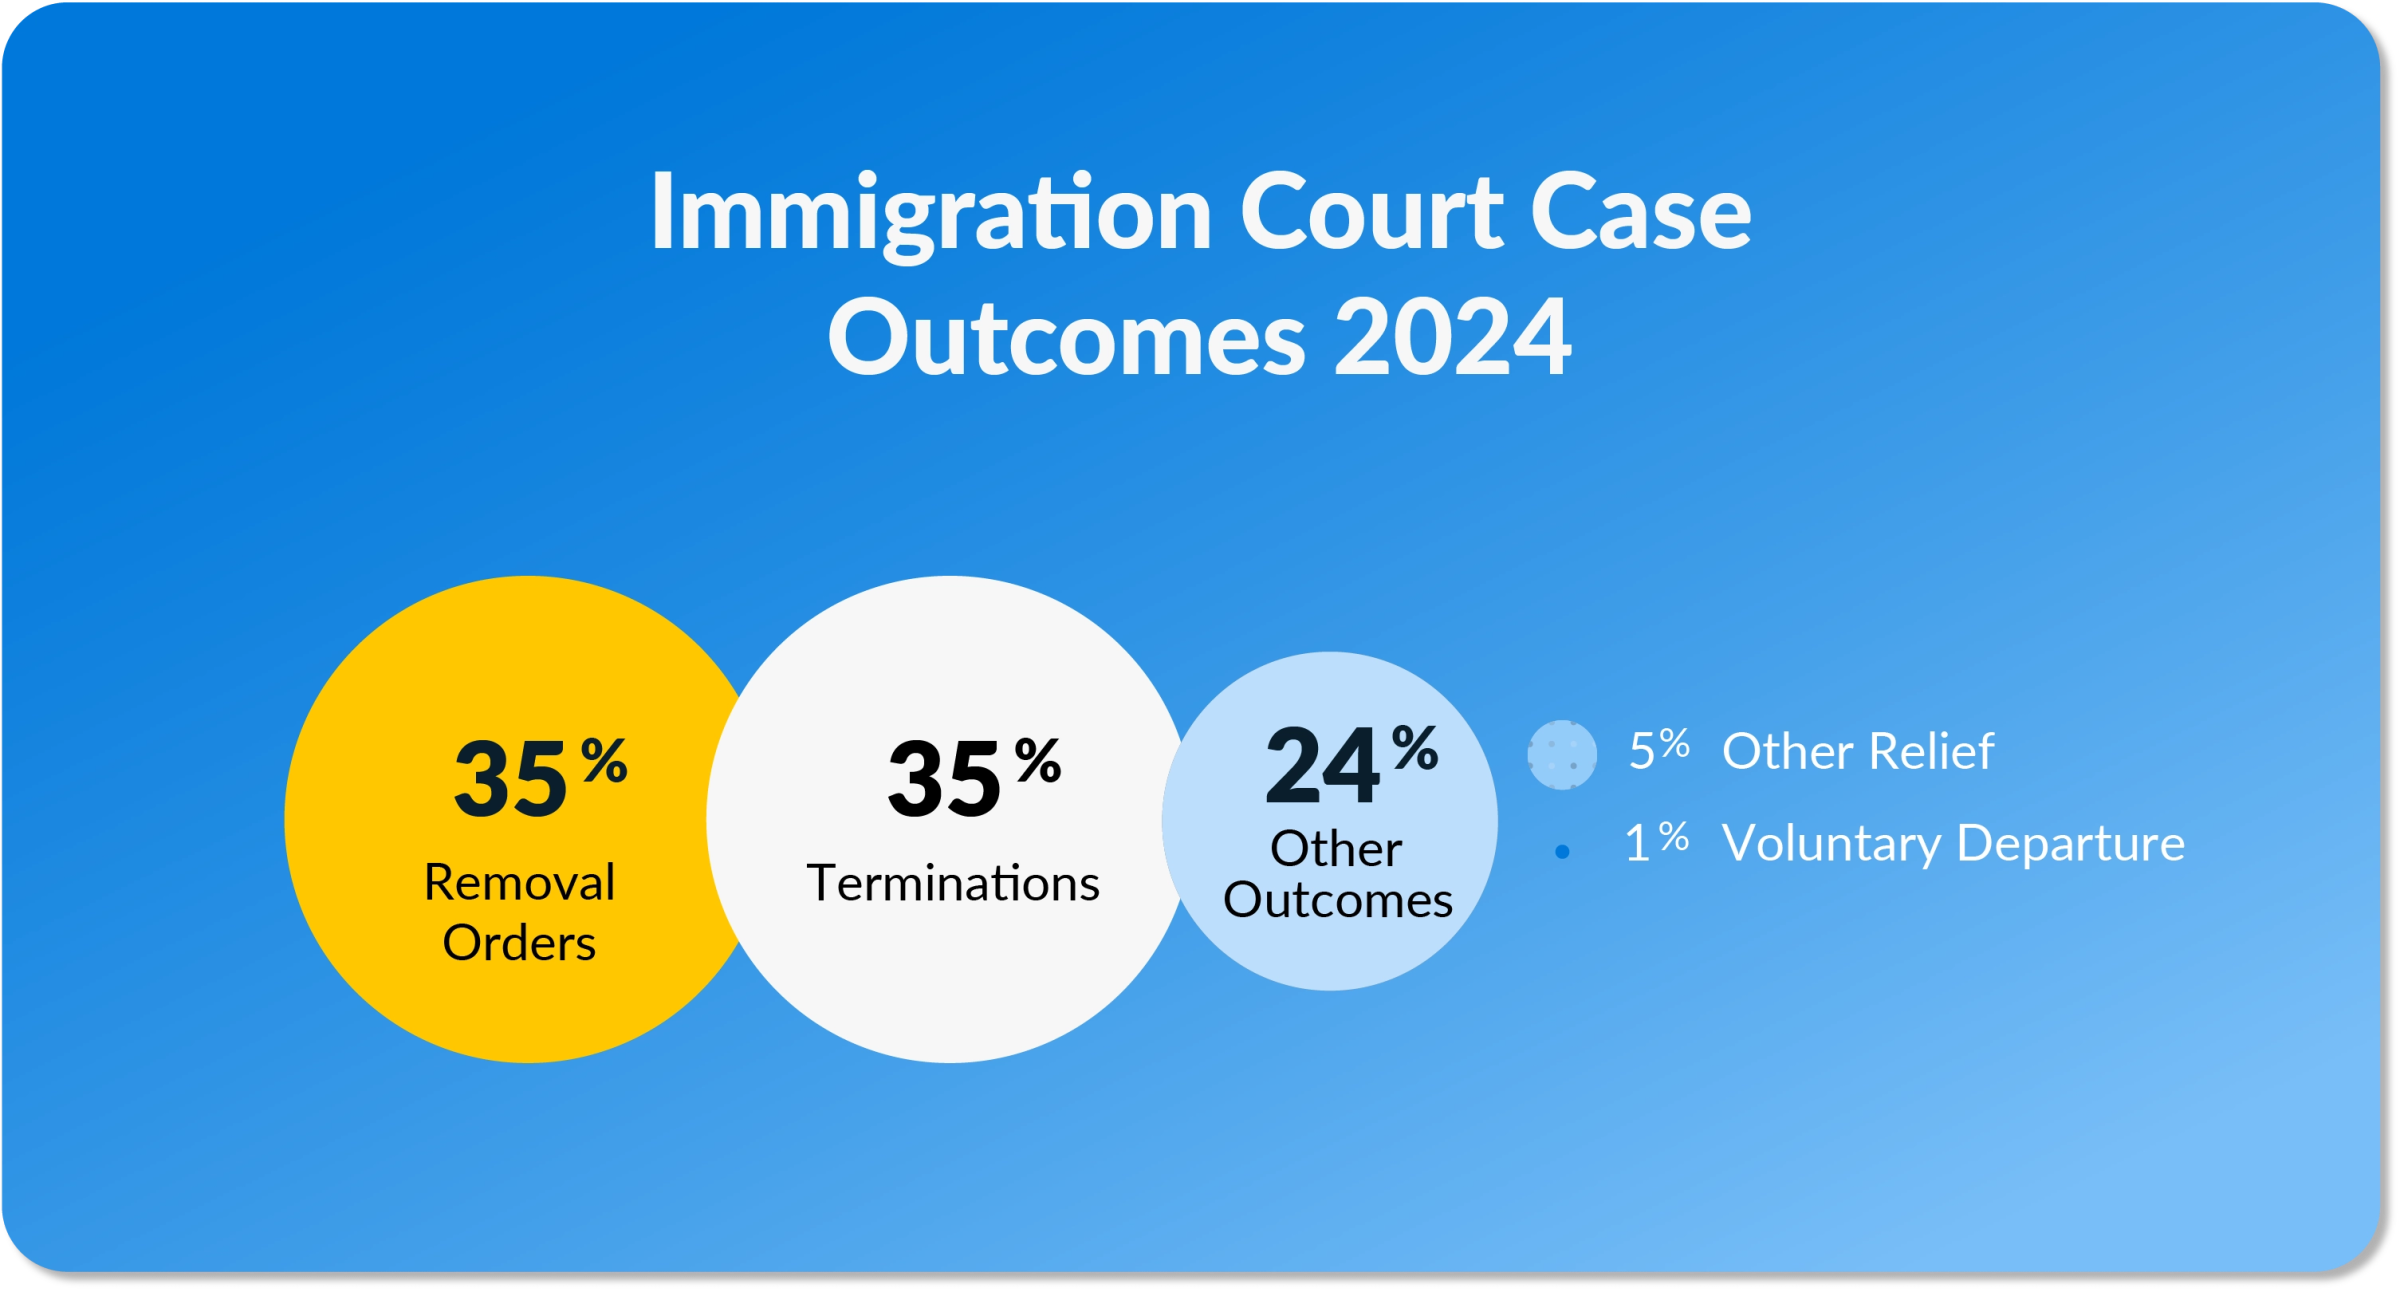
These year-over-year trends illustrate a system where most outcomes result in either removal or termination, with only a small percentage leading to successful immigration outcomes like asylum or cancellation of removal. This consistency across years provides a valuable benchmark for attorneys advising clients on risk, timeline expectations, and strategic case planning.
Court Case Outcomes by Nationality
Nationality plays a notable role in court outcomes, with significant disparities observed across origin countries. In 2024, court completions data reveals the following:
Venezuela: 164,419 completions; 46,724 removal orders; 15,150 grants of relief; 86,477 other outcomes
Guatemala: 114,979 completions; 56,098 removal orders; 2,272 grants of relief; 39,199 other outcomes
Honduras: 111,203 completions; 54,978 removal orders; 2,261 grants of relief; 33,171 other outcomes
Mexico: 89,490 completions; 40,269 removal orders; 1,775 grants of relief; 28,878 other outcomes
Cuba: 65,003 completions; 13,202 removal orders; 7,214 grants of relief; 40,195 other outcomes
These figures highlight how geopolitical context, eligibility criteria, and legal precedent shape case trajectories. For instance, Venezuelans received relief at significantly higher rates than individuals from Guatemala or Mexico, where relief was granted in only a small fraction of cases. This highlights the importance of tailoring legal strategies to individual circumstances and national trends.
Immigration Court Case Backlog Data
Many are surprised at just how many immigration cases are pending; the scale of the backlog continues to test the system's limits. This is primarily due to heightened enforcement actions, expanded border filings, and limited judicial resources.
Let’s break down the backlog and what it looks like for immigration firms.
Court Backlog by Year
Backlog growth over the last five years has been stark, nearly tripling between 2020 and 2024:
2020: 1.3 million pending cases
2021: 1.5 million pending cases
2022: 2.0 million pending cases
2023: 2.8 million pending cases
2024: 3.7 million pending cases
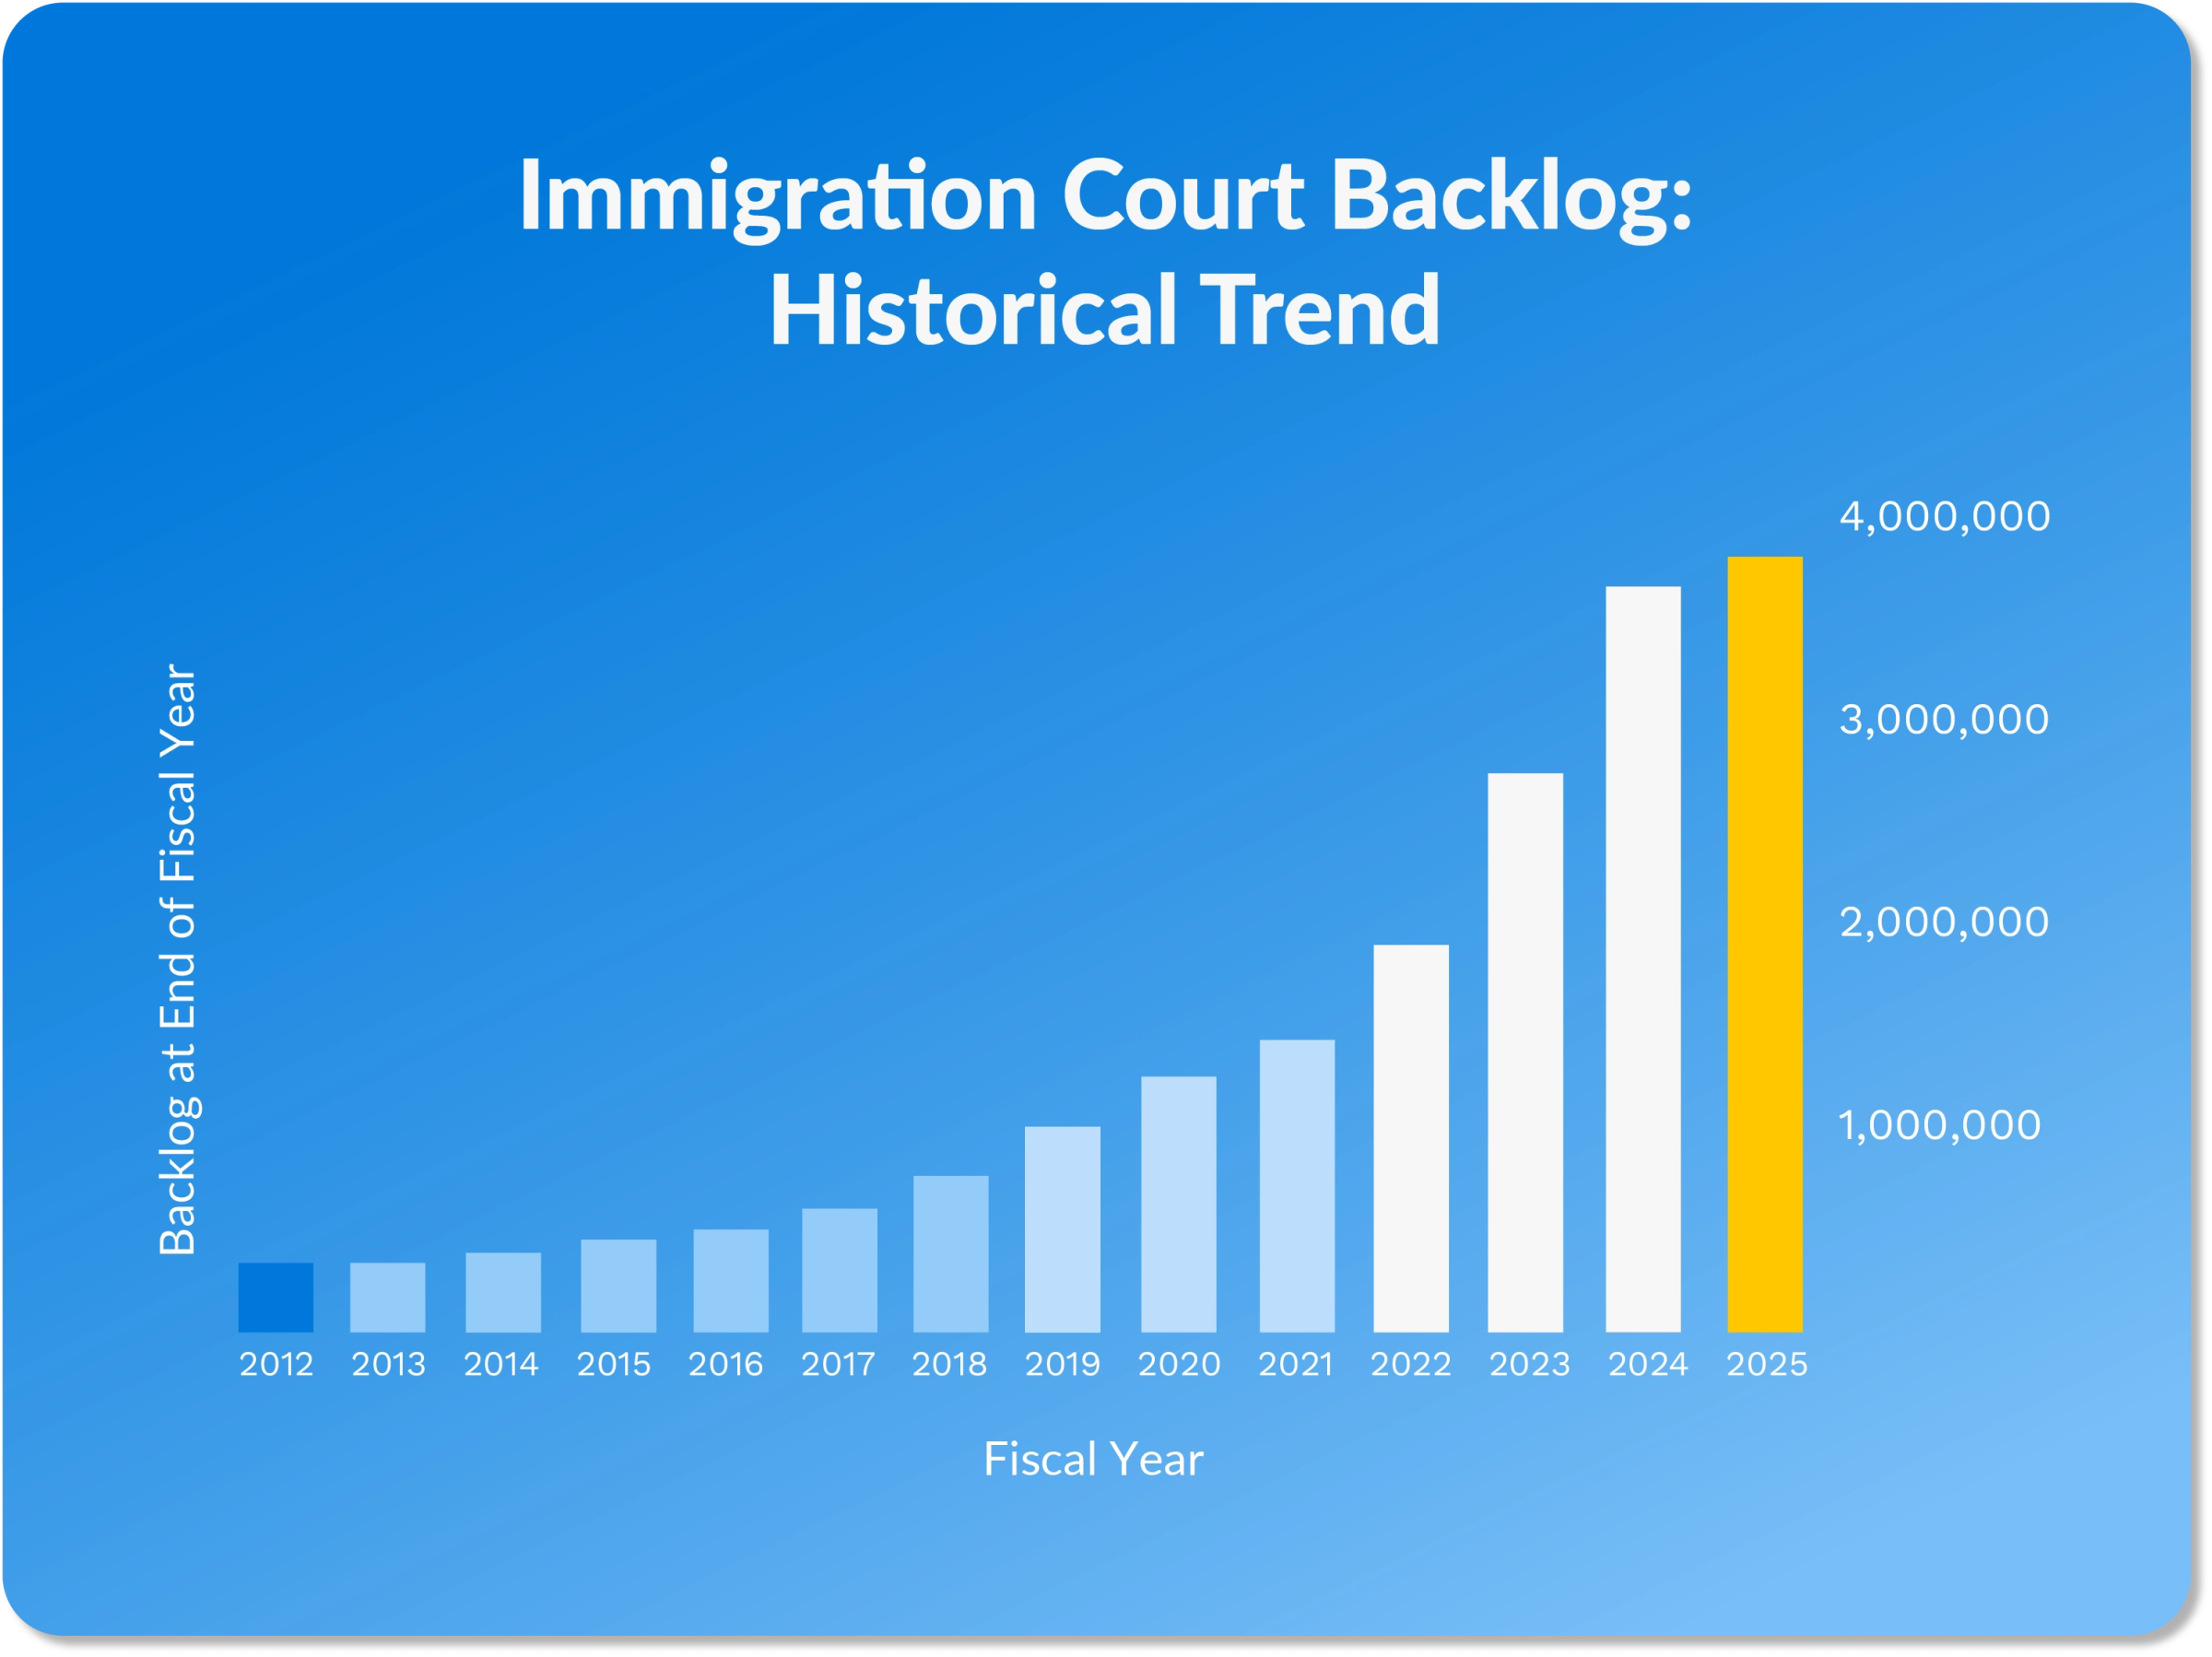
The sharpest climb occurred between 2023 and 2024, with nearly 1 million new cases added in just 12 months. This acceleration marks a critical inflection point, showing systemic inefficiencies and the urgent need for expanded court capacity.
Court Backlog by County of Origin
As of the end of 2024, the countries with the largest shares of pending cases included:
Mexico: 800,000
Guatemala: 450,000
Honduras: 400,000
Venezuela: 360,000
These four countries alone account for a significant portion of all unresolved immigration cases. While the total volume fluctuates, these nationalities consistently lead in pending court matters, emphasizing the importance of tracking demographic shifts when building firm strategy.
Court Backlog by City
Urban courts face especially high backlogs. The top cities for pending immigration cases at the end of 2024 included:
New York, NY: 263,000
Los Angeles, CA: 207,000
Houston, TX: 196,000
Miami, FL: 172,000
San Francisco, CA: 160,000
Depending on jurisdiction, these localized pressures result in dramatically different wait times and processing efficiencies. Firms serving clients in high-volume areas may need to adjust timelines, staffing, and communication strategies accordingly.
Immigration Court Backlog Wait Times
As of early 2024, the immigration court backlog wait times average around 1,424 days, or approximately 3.9 years, according to Syracuse University’s Transactional Records Access Clearinghouse. While this national average is staggering, it only tells part of the story.
In reality, wait times vary dramatically by location, influenced by local case volume, judge availability, and court resources. According to TRAC Immigration data:
In San Francisco, Chicago, Houston, San Antonio, Denver, and Arlington, cases now often wait over 1,400 days for hearings
In New York City, wait times extend even further, into the early 2030s, for newly filed cases
These regional differences stem from multiple factors, including surges in new case filings, regional enforcement patterns, and disparities in court staffing and infrastructure. Courts in densely populated areas or along major migration corridors tend to be especially overburdened.
The Impact of Representation on Case Outcome
Legal representation dramatically improves the chances of successful immigration outcomes, particularly in asylum cases. In 2024, 53% of asylum seekers with legal counsel were granted relief, compared to just 17% of those who were unrepresented. This stark contrast highlights the critical role that skilled advocacy plays in securing favorable results. With legal representation, applicants are more likely to present complete and well-supported claims, meet procedural requirements, and effectively navigate the evidentiary demands of immigration courts.
For law firms, this data reaffirms the importance of ensuring clients receive full representation, particularly in high-stakes cases like asylum, where the consequences of denial can be life-altering. It also bolsters the case for expanding pro bono and low-cost legal services to ensure more immigrants have access to justice.
Strategic Insights for Immigration Law Firms
Immigration attorneys can use these immigration court statistics not just to understand the state of the system but also to sharpen their operations, serve clients, and plan for the future. Macro-level data—like case volumes, approval rates, and regional backlog trends—can reveal powerful micro-level insights that help law firms make smarter business decisions. Whether it’s identifying high-demand service areas, evaluating the return on specific case types, or preparing for shifting visa trends, data-driven planning can improve efficiency and profitability.
Below, we’ll dive into some actionable strategies legal professionals can consider from this data:
Judge- and Court-Specific Strategy
With judge-level data, such as grant rates and average case durations, firms can inform targeted litigation strategies. For example, experienced attorneys can be assigned to high-denial courts and better prepare clients in jurisdictions with longer timelines. Understanding local court patterns also helps manage expectations and refine case presentation. Over time, tracking outcomes by judge and location can become a strategic asset in delivering more consistent, successful results.
Geographic Demand Forecasting
Analyzing immigration court backlog data by city allows firms to anticipate where future demand for legal services will be highest. Courts in cities like New York, Los Angeles, and Houston now hold some of the nation’s largest caseloads, signaling opportunities for regional expansion or targeted outreach.
Firms can use this information to decide where to open new offices, deploy staff, or increase marketing efforts. Aligning resources with geographic demand can ensure more responsive service delivery and support long-term growth.
Case Type ROI Optimization
Firms can assess which case types offer the best return on time and resources by examining approval rates, processing times, and the frequency of RFEs or NOIDs. For example, if family-based cases are experiencing extended delays or high complication rates, it may be more strategic to focus on employment-based petitions or humanitarian relief with faster adjudication.
This approach helps firms allocate staff more effectively, manage workloads, and improve client satisfaction. Data-driven case selection can also minimize burnout and improve overall profitability by focusing on high-yield, lower-friction matters.
Download the 2025 State of Immigration Report
Immigration court statistics offer more than just context; they provide a foundation for strategic decision-making. From analyzing backlogs to forecasting timelines, these insights help immigration law firms streamline operations, set realistic expectations, and deliver better outcomes for clients.
The 2025 State of Immigration Report offers a comprehensive look at immigration court decisions, visa trends, green card data, and naturalization patterns across the country. Whether you're managing growing caseloads, planning resource allocation, or identifying new service opportunities, this report is an essential guide to navigating today’s immigration landscape.
Download the full 2025 State of Immigration Report for more in-depth, data-driven insights.
About the author

Mary Elizabeth Hammond is a Senior Content Strategist and Blog Specialist for Docketwise, a leading professional business solution. She covers emerging legal technology, financial wellness for law firms, the latest industry trends, and more.