In 2024, the United States saw over 100,000 affirmative asylum cases completed by U.S. Citizenship and Immigration Services (USCIS), with offices in Miami, Arlington, and Houston leading in case volume. For immigration lawyers, understanding why people seek asylum is fundamental—not only to better serve clients but also to identify trends that may impact the volume and types of cases they encounter.
First, it’s important to consider: Why do people seek asylum? Asylum is legal protection granted to individuals fleeing persecution in their home countries based on race, religion, nationality, political opinion, or membership in a particular social group. But asylum statistics are more than just numbers; they reflect humanitarian need, shifting policy, and evolving legal challenges.
The 2025 Legal Industry Report: State of Immigration offers a comprehensive look at the data shaping immigration law today, including asylum case trends and other key statistics. Understanding these metrics is essential for immigration law firms to successfully navigate case strategy, allocate resources, and forecast client demand.
In this article, we’ll share data and asylum statistics from the 2025 State of the Immigration Report and explore insights on:
Asylum approval rate by country, state, and city
Where asylum seekers in the USA are coming from
How legal representation affects case outcomes
Business strategy insights for law firms based on macro asylum data
How Many People Are Granted Asylum in the U.S. Every Year?
The number of asylum seekers in the U.S. per year fluctuates based on a combination of factors, including domestic policy and international events. Changes in presidential administrations, shifting enforcement priorities, and evolving eligibility criteria can all influence the flow of applications. At the same time, surges in applications from regions like Venezuela and Ukraine in recent years highlight how political instability and humanitarian crises influence asylum patterns.
These conditions often create waves of migration that place increased pressure on legal systems and available resources. Understanding these dynamics helps immigration law firms prepare for client demand and tailor resource planning accordingly.
Total Asylum Processing Per Fiscal Year (in Arlington, Boston, Chicago, Houston, Los Angeles, Miami, New Orleans, New York, Newark, San Francisco, Tampa):
2022: 39,023
2023: 54,659
2024: 100,394
Explore the I-589 asylum application process to better understand the procedural steps behind these rising case volumes.
Which U.S. Cities Handle the Most Asylum Cases?
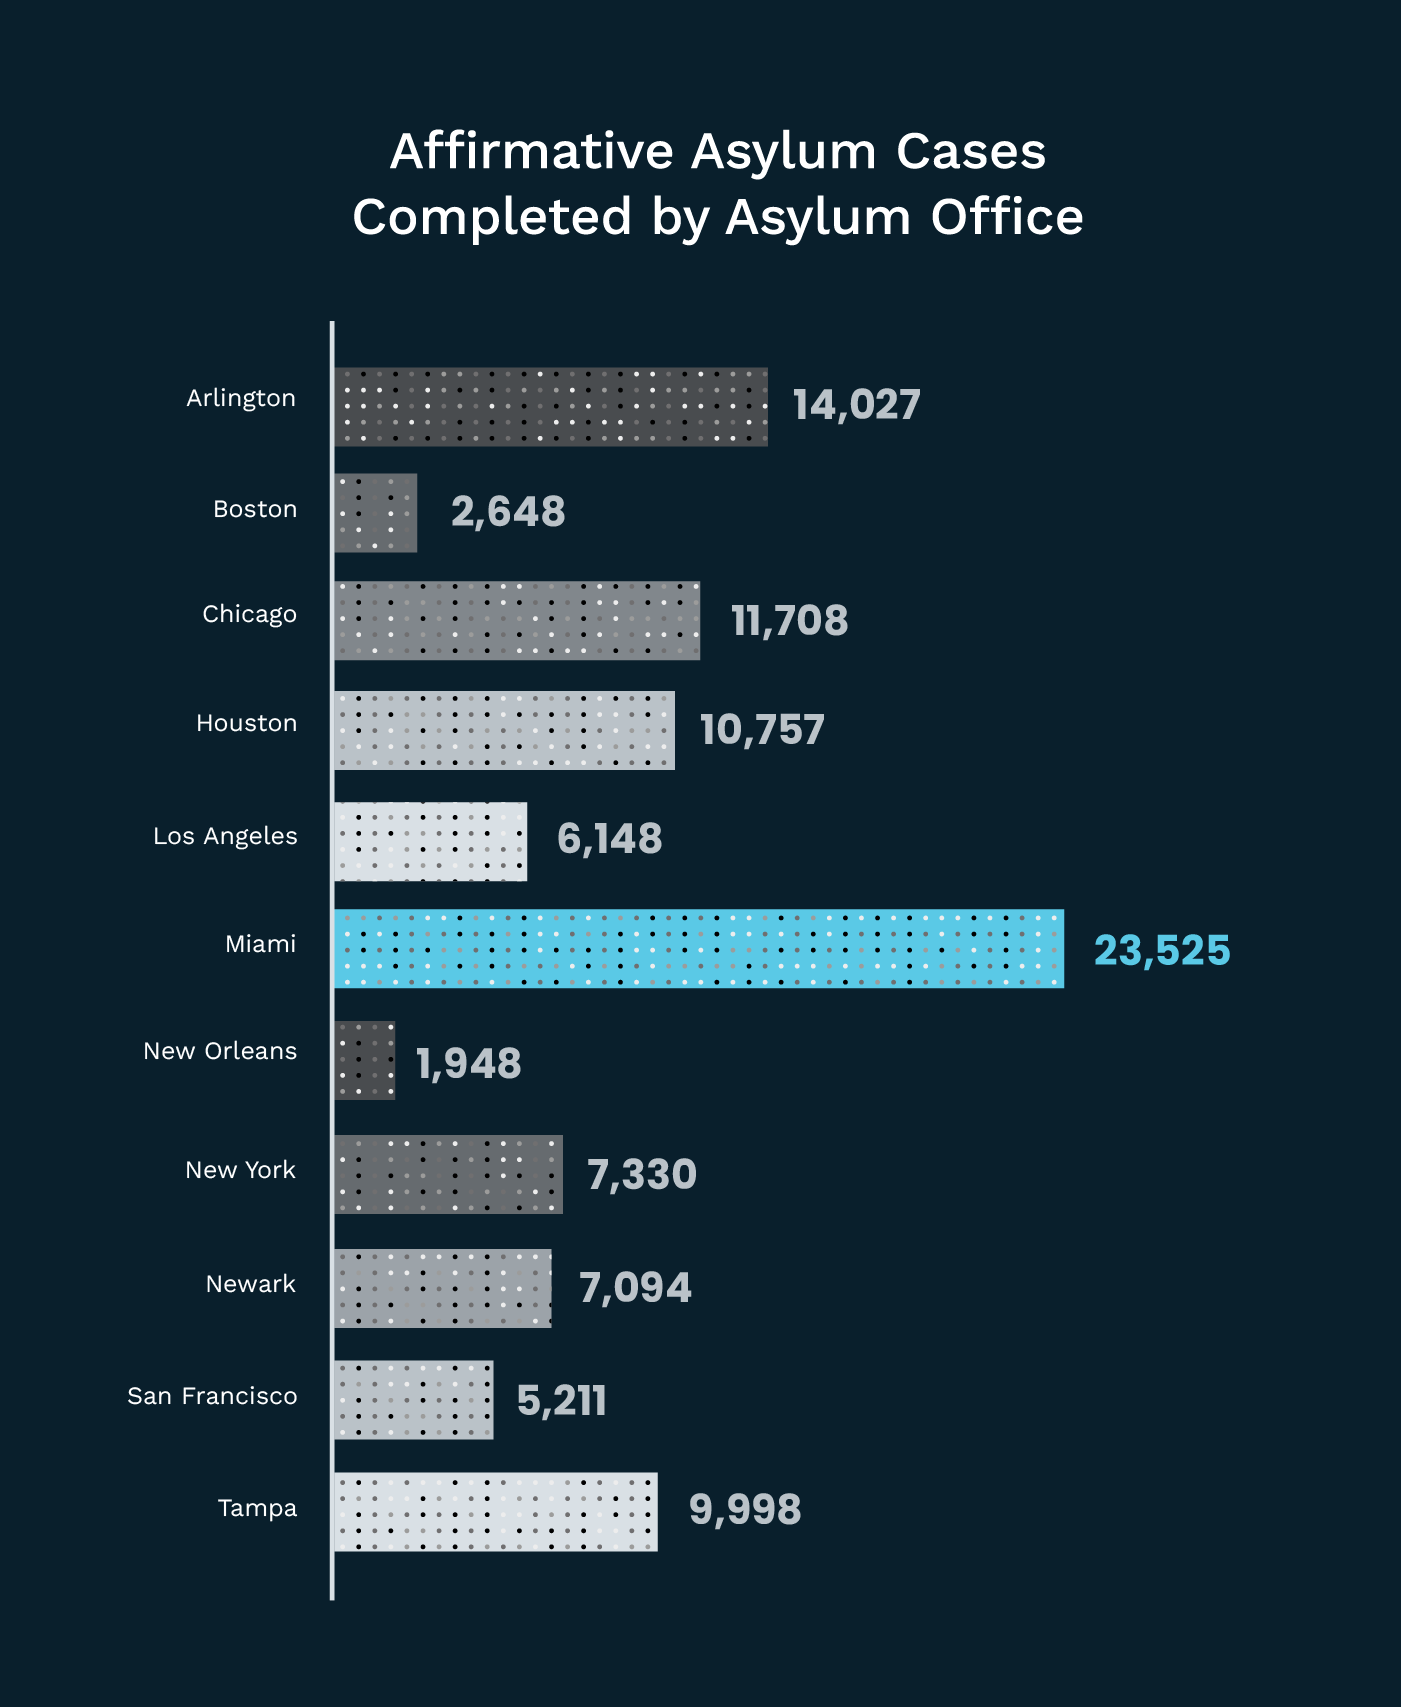
In 2024, the top USCIS asylum offices by volume of completed cases included:
Arlington: 14,027 cases
Chicago: 11,708 cases
Houston: 10,757 cases
Los Angeles: 6,148
Miami: 23,525 cases
New Orleans: 1,948
New York: 7,330
Newark: 7,094
San Francisco: 5,211
Tampa: 9,998
These figures underscore how geographic differences directly influence the experience of asylum seekers and the lawyers who represent them. For example, Miami’s high volume may contribute to longer processing times and heavier backlogs, potentially delaying relief for applicants. Arlington’s comparatively lower volume, while still substantial, may offer slightly faster resolution depending on local staffing and court efficiency.
Regional disparities also reflect differences in local populations and migration patterns, with South Florida and Texas serving as common entry points for individuals from Latin America and the Caribbean. Legal professionals in these jurisdictions must contend with high demand and systemic delays, requiring strategic planning, resource prioritization, and possibly triaging cases based on urgency or complexity.
Immigration lawyers practicing in these metro areas should anticipate long wait times and higher client demand and develop contingency plans to navigate uneven adjudication timelines effectively.
Where Are Asylum Seekers Coming From?
The top countries of origin for asylum seekers often mirror global unrest. Armed conflict, authoritarian regimes, and targeted violence are key drivers that compel individuals to flee their home countries and seek protection in the U.S. Asylum claims frequently reflect these regional crises, and understanding the geopolitical context is critical for immigration practitioners when preparing applications.
So, what countries can seek asylum in the U.S.? Legally, individuals from any country may apply, but approval rates vary significantly based on factors such as documentation, case credibility, and conditions in the applicant’s home country. Asylum applications may either be affirmative (for individuals who are currently in the U.S. and not in removal proceedings) or defensive (for those who are in removal proceedings).
Asylum Approval and Denial Rates by Region
Approval and denial rates for asylum cases often hinge on two major factors: where the applicant is from and where their case is heard in the U.S. In 2024, approval was much more likely for applicants from crisis-stricken countries like Venezuela, Syria, and Cameroon. In contrast, those from more stable regions typically faced lower approval odds.
Location within the U.S. matters too. Applicants filing in states like California and New York, where access to legal aid is stronger, tend to fare better than those in places like Texas or Georgia, where resources can be limited and where political conservatism or proximity to the border could potentially affect discretionary findings by adjudicators.
Many ask, "What are the chances of getting asylum?" It depends, but without legal support and in tougher jurisdictions, the odds can be steep. These trends make it essential for attorneys to factor regional nuances into strategy and client counseling.
In this section, we’ll answer how many asylum cases are approved, broken down by location.
Asylum Approval Rate by Country
Asylum approval rates by country in 2024 showed significant variation, closely tied to country-specific conditions and the credibility of applicants' claims. Individuals from countries experiencing severe humanitarian crises and political instability—such as Afghanistan, Cameroon, Syria, and Venezuela—had the highest grant rates through defensive asylum pathways, with approval rates exceeding 75% in many cases.
These high success rates reflect well-documented threats of persecution and violence in those regions. In contrast, applicants from countries with less severe or less well-substantiated conditions were far less likely to be granted asylum. This disparity underscores the critical role that country condition reports, expert testimony, and thorough documentation play in substantiating claims and securing relief for asylum seekers.
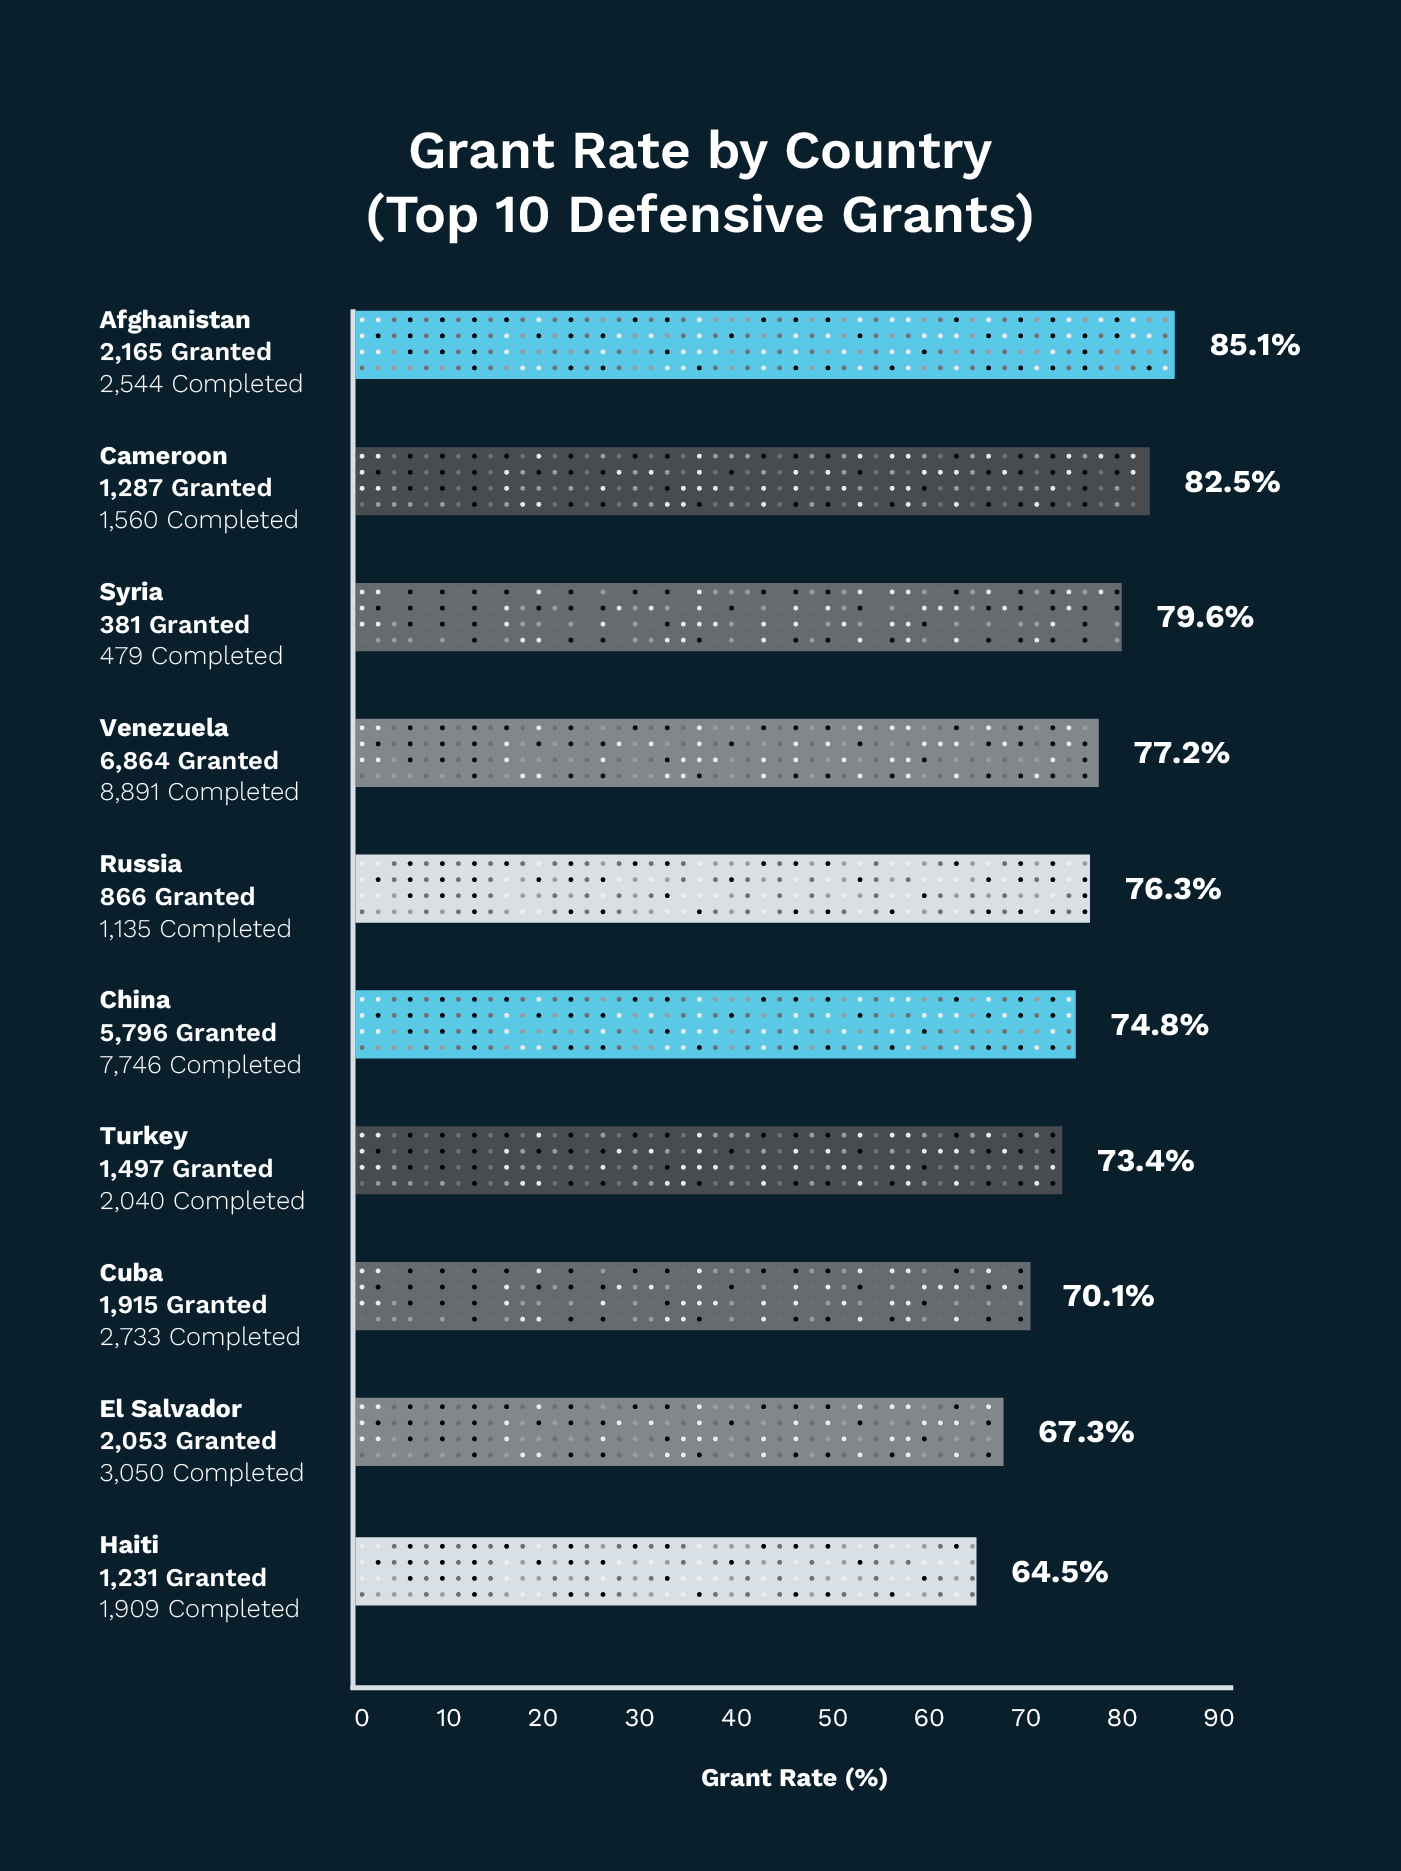
In 2024, individuals from the following countries had the highest grant rates through defensive asylum pathways:
Defensive Grants
Rank | Country | Grant Rate (%) | Granted | Total Completed |
1 | Afghanistan | 85.1% | 2,165 | 2,544 |
2 | Cameroon | 82.5% | 1,287 | 1,560 |
3 | Syria | 79.6% | 381 | 479 |
4 | Venezuela | 77.2% | 6,864 | 8,891 |
5 | Russia | 76.3% | 866 | 1,135 |
6 | China | 74.8% | 5,796 | 7,746 |
7 | Turkey | 73.4% | 1,497 | 2,040 |
8 | Cuba | 70.1% | 1,915 | 2,733 |
9 | El Salvador | 67.3% | 2,053 | 3,050 |
10 | Haiti | 64.5% | 1,231 | 1,909 |
Asylum Approval Rate by U.S. City
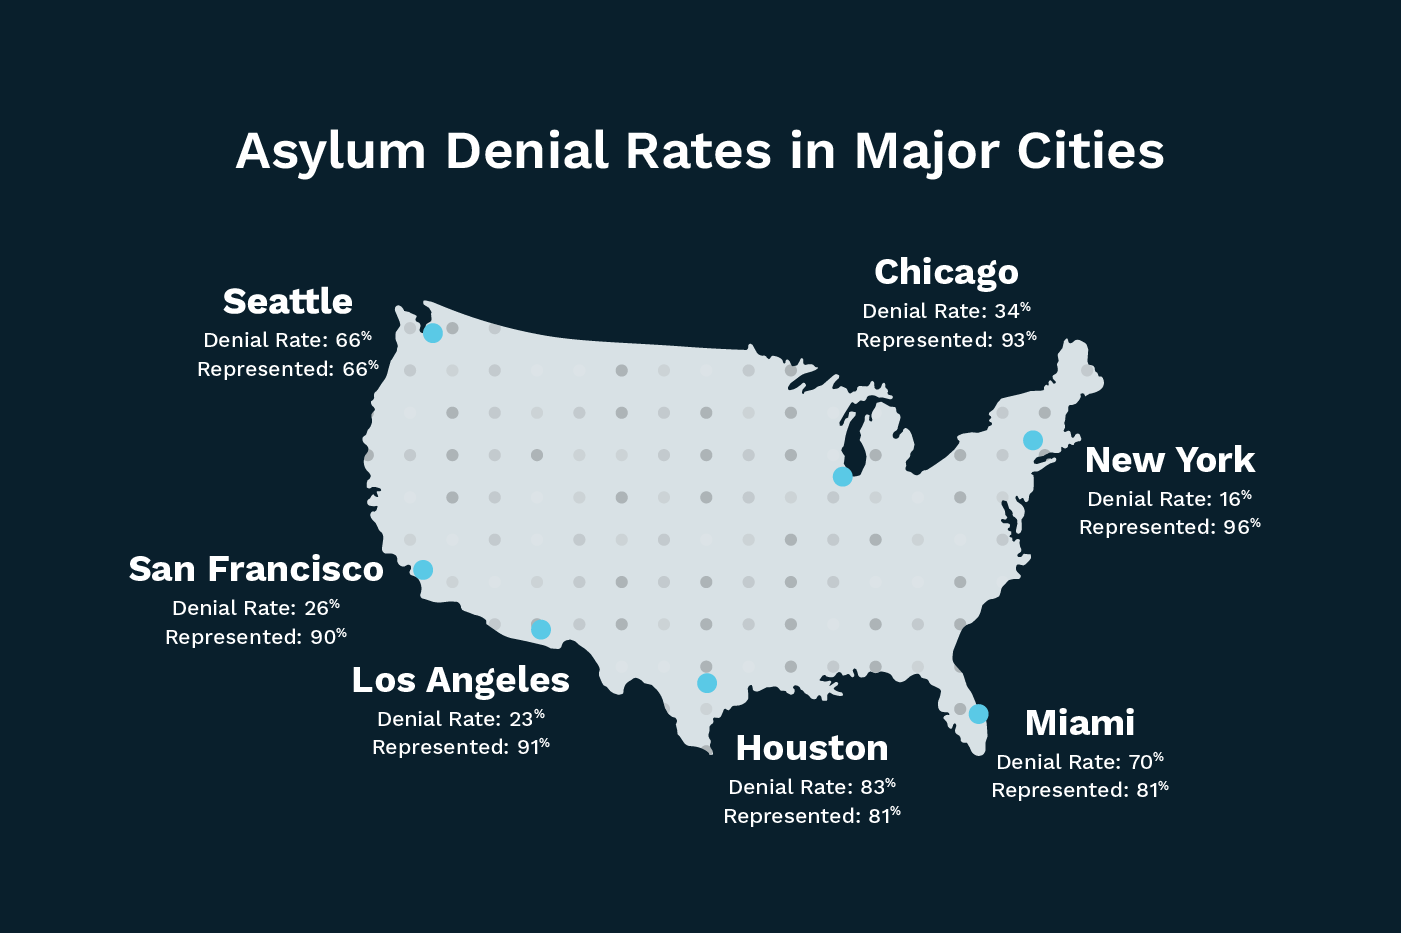
In 2024, city-level data showed sharp contrasts in asylum approval and denial rates. For example, according to the 2025 State of Immigration Report:
San Francisco: 26% denial rate, with 90% of applicants represented by legal counsel
Chicago: 34% denial rate, with 93% represented
New York City: 16% denial rate, with 96% represented
Miami: 70% denial rate, with 81% represented
Houston: 83% denial rate, with 81% represented
Los Angeles: 23% denial rate, with 91% represented
Seattle: 66% denial rate, with 66% represented
Local court culture, availability of interpreters, and even individual judge tendencies all influence these outcomes. For firms, understanding how geography affects success rates is vital for client intake strategy and risk assessment.
Why Legal Representation Changes the Outcome
Legal representation is the most significant predictor of asylum success. Data from the 2025 State of Immigration Report tells a compelling story:
83% of applicants in 2024 were represented by counsel. Of those, 53% were granted asylum and just under 47% were denied. A small fraction received other forms of relief.
17% of applicants lacked representation. Their outcomes were far more sobering: Only 19% were granted asylum, and 81% were denied. Even with alternative relief included, success remained rare.
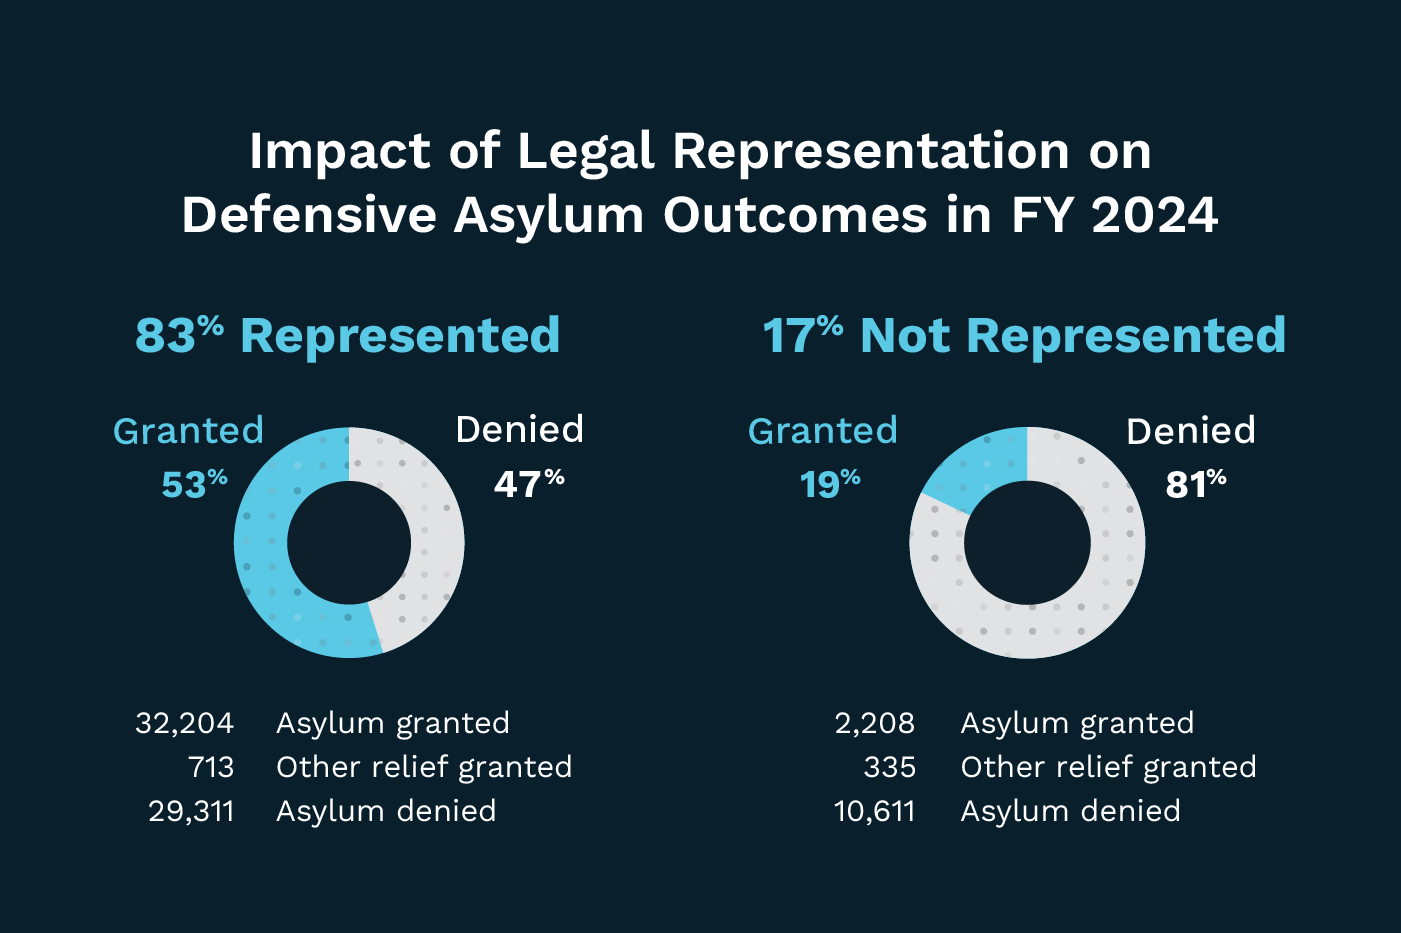
This stark contrast illustrates how legal guidance can shape the outcome of an asylum case. Representation not only increases the odds of approval, but it also ensures procedural rights are respected and the strongest possible case is presented.
For law firms, this data emphasizes the importance of scaling legal support models. Whether through full-scope representation, limited-scope services, or partnerships with nonprofits, access to competent legal help is one of the most powerful tools for improving client outcomes.
Strategic Insights for Immigration Law Firms
Law firms can convert macro-level asylum statistics into micro-level decisions by leveraging national trends to guide local strategy. From identifying high-demand regions to assessing the profitability of case types, data-driven insights help firms adapt in a competitive and evolving practice area. This type of intelligence supports smarter growth, targeted outreach, and optimized service delivery—key advantages for immigration practices navigating fluctuating policy and client needs. These high-level insights offer more than academic value—they provide a roadmap for how to market smarter, allocate staff, and streamline services.
Forecasting Demand by Region
By watching regional trends in asylum filings, naturalizations, and refugee resettlement, immigration firms can pinpoint cities or states with rising demand. For example, firms may consider expanding their presence or boosting outreach in areas with high volumes of USCIS offices, such as Miami and Houston.
This kind of insight can guide smart decisions around office expansion, staffing multilingual attorneys, or launching targeted outreach programs in underserved but fast-growing communities.
Marketing Spend Allocation
Understanding which countries and regions are seeing an increase in asylum applications, such as Central America and Eastern Europe, gives firms a valuable edge when planning outreach.
Using data like visa issuance trends and nationality-based approval rates, immigration law firms can fine-tune their digital ad spend, focus outreach efforts on high-likelihood client segments, and prioritize campaigns in regions with higher conversion potential. This targeted approach can lead to a better marketing ROI and a client base that aligns with your firm’s strengths.
Prioritizing Case Types for Efficiency
Firms may favor cases with clearer timelines and higher margins—for example, prioritizing affirmative asylum filings over complex defense work with long backlogs in the Executive Office for Immigration Review (EOIR). Using data on average processing times, denial rates, and frequency of requests for evidence (RFEs), lawyers can map out which case types are best suited for their team’s strengths and resources.
For example, if USCIS affirmative asylum approvals are trending upward with shorter timelines, a firm may double down on these cases. Conversely, courts with high denial rates and protracted timelines may be reserved for more senior staff or avoided altogether in favor of more predictable work.
Judge and Court-Specific Strategy
TRAC data on judge behavior can inform case assignments and preparation. With insight into each judge’s grant and denial rates, law firms can build internal profiles to guide who takes which cases. For example, firms might assign senior attorneys to high-denial judges or courts with significant backlogs, while newer attorneys handle jurisdictions with higher approval rates. This granular approach helps improve win rates, reduce surprises, and manage client expectations more effectively, especially in defensive asylum proceedings where local dynamics matter immensely.
Tip: Learn more about helping asylum seekers with a limited-scope, tech-enhanced representation and AI-assisted solution in this podcast episode.
Download the 2025 State of Immigration Report
Want to stay one step ahead in a rapidly evolving immigration landscape? The Docketwise 2025 State of Immigration Report provides a clear, data-backed look at national and state-level trends—from asylum approvals and naturalizations to immigration court outcomes. It’s more than just a data roundup; it’s a strategic tool. Immigration law firms can use this insight to spot growth opportunities, fine-tune their services, and focus marketing efforts where demand is rising.
It’s the kind of report that turns big-picture immigration data into actionable plans for your practice.
About the author

Mary Elizabeth Hammond is a Senior Content Strategist and Blog Specialist for Docketwise, a leading professional business solution. She covers emerging legal technology, financial wellness for law firms, the latest industry trends, and more.